
So, you're sold on the power and importance of email marketing (if not, see part 1) and you're keen to start working on your e-marketing strategy. You may already be using email marketing as part of your store's marketing and communications strategy, but you know you've got to measure it, don't you?
Not measuring and benchmarking your email marketing is, as the Brits would say, "like pissing into the wind." Or, to out it into cycling terms, it's like training without keeping a training diary or recorded data. Apart from 'feel,' you have virtually no idea whether what your doing is working, why it's working when it does, what to replicate and what to stop doing, and what needs improvement or tweaking.
Email 'Process Metrics' - What should I be measuring and why?

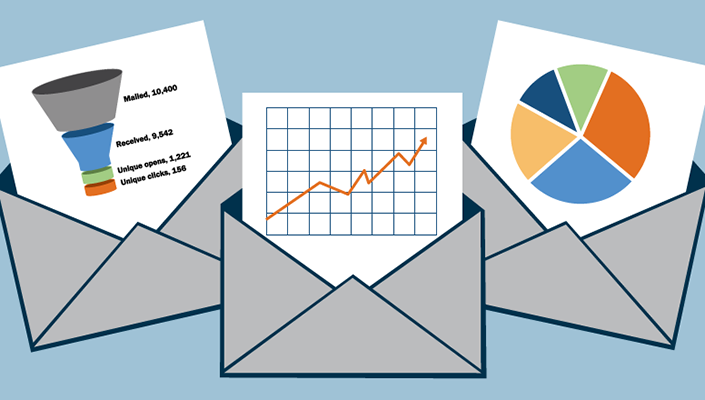
Process Metrics are the diagnostics that illustrate how the various elements of your email send-outs have performed. It should be monitored every time you send out marketing related emails and tracked longitudinally.
There are some quite sophisticated metrics which professional digital marketers will be looking at (retention, engagement, share of wallet etc.), but the following are the key process related elements you should be looking at, as well as the easiest to understand and to improve upon.
1. Open Rate - the percentage of emails opened versus the number sent out.
Why is this important? In simple terms, it illustrates how catchy or relevant your subject line was, as well as how trusted your business or brand is.
If your email marketing is going to have any effect on improving your sales, foot-traffic, web traffic, brand awareness, brand value, or whatever it is you are trying to achieve, it has to be read first. And to be read, it needs to be opened in the first place. High open-rate: good. Low open-rate: bad. Low open rates will suggest you need to look at a few things, including: message appeal, message relevance, your brand value/perception, timing of delivery, or poor delivery rate.
2. Click Through Rate - the number of 'openers' (yes, that's what they're called) who then clicked through to your promotion, message, content, etc.
Why is this important? It directly points to the relevance of your message, the value of your offer, your content quality, and basically whether it hit its mark or not.
If your click through rate is poor, it shows you need to improve your targeting (offers on road bikes to previous road bike purchasers and so on), the thinking about message value (is it a price, product, or value-add that will spark a purchase or inquiry response?), and whether the email looked professional, attractive, and was easy to digest.
3. Bounce & List Churn Rate - how many emails failed to be delivered, or even worse, were actively rejected or prompted a spam complaint or unsubscribe.
Why is this important? Firstly, it tells you how up to date and accurate your email address list is. Secondly, it suggests whether your emails are valued, welcomed, or deemed appropriate.
Think about bounce and churn as the customers who walked into your store and then straight back out again, the ones who complained about the sales person being pushy or for following them around the store, and the customers who never came back. Needless to say, high bounce and churn rates are not good for your sales performance and also a signal you are not doing things right.
Email Metric Benchmarks - What sort of numbers should I be aiming for?
Monitoring and measuring your process metrics over a period of time will provide you your own baselines and benchmarks. However, it's useful to understand what benchmarks are the norm globally, and most importantly, in your territory and industry.
To my knowledge, there is no benchmark data on email marketing metrics available specific to bicycle retailers. So, I'll run with the benchmarks for 'Retail & Ecommerce' email marketing, which is certainly available, as well as the benchmarks per territory.
Also, I'll only bother listing the 'median' percentages, as opposed to the 'mean' percentages. If you have forgotten the difference, you'll need to refer back to your junior high math books. But, the rates that the likes of Amazon, eBay, Chain Reaction, and Wiggle get on their email marketing kind of blows the data out for the likes of 'Joe's Bikes & Mowers,' if you get my point.
1. Open Rate Benchmarks

image: socialtalent.co
If you're scoring Open Rates of 33.8% or higher, you're performing in the top quartile globally. Well done. But, if you're only securing 6.6% Open Rates or less, you're in the bottom quartile. Maybe it is time to review your message title, targeting, and timing.
Sending 'Transactional Emails' will more than double those rates, with top-notch email marketers seeing their messages opened more than three quarters of the time.
What's a 'Transactional Email'? Basically any email that wasn't bulk sent and was in direct response to an action (or inaction) by the recipient, such as subscribing to your website, booking in their bike for a service, purchasing something from you, or abandoning their shopping cart on your ecommerce site.
2. Click Through Rate Benchmarks
Now the numbers start to look a lot smaller, don't they? Which only serves to emphasize just how important it is that you get every element right. Think about British Cycling's successful 'marginal gains' strategy. They look to improve every aspect of their performance by 1%. And when it comes to email marketing, so do you.
Top quartile e-marketers in Retail & Ecommerce record CTRs of 7.5% or more, while bottom quartile marketers are lucky if they score 0.3% CTRs.
RELATED: Why Women Could Save Your Bike Shop
3. Bounce & List Churn Rate Benchmarks
As with Open Rate and Click Through Rate metrics, there are several sub data sets you can look at. But, let's look at the two major metrics: Hard Bounce Rate and Unsubscribe Rate.
Hard Bounce Rate is basically the emails that literally 'bounced' back to you. You'll receive a notification telling you every time this happens. This typically identifies out of date or incorrect email addresses in your data set or the level of your 'Data/Contact Hygiene' (not my favorite term to use, I have to admit). A simple, but essential, metric to constantly work on improving, for obvious reasons.

image: mautic.org
Good news for those of you working in Retail & Ecommerce, because your industry has by far the lowest HBR globally. Great to be offering what people want, isn't it? Globally, top quartile e-marketers see their emails bounce less than 0.001% of the time, whereas bottom quartile marketers record 1% and greater HBR every time they send out a message, (ouch).
Apparently the reason for Canada's virtually zero unsubscribe and HBR numbers is because Canadian companies regularly send re-opt in subscription emails, which compels subscribers to regularly re-commit. While it does whittle down the total customer list, it results in people on your list who definitely want to be there and are always happy to receive your messages. Something for us all to learn from, I think.
Top quartile Retail & Ecommerce marketers record Unsubscribe rates at less than 0.0197%, with bottom quarter marketers scoring more than 0.288% Unsubscriptions.
I know these numbers seem very small and insignificant to you, but to put it into a context you might value; If you can lower your Unsubscribe rate by just 0.1%, that means you would be keeping 100 customers every time you send out an email, should you have 100,000 customers on your list. That's 10,000 customers extra you keep per year, based on sending out 4 emails per week.
Like I said, these metrics and benchmarks really matter and it will pay you to constantly monitor and work on improving them.
There is another major set of metrics we can look at, called Output Metrics. But let's discuss those when you've got these simple, but essential, metrics working for you and your business. For now, start by making sure that the service you use to send you emails has good tracking and analytics reporting, and then be sure to you keep an eye these important stats for each email that you send.
Sources:
- 2015 Email Marketing Metrics Benchmarks Study - SilverPop, IBM Marketing Cloud
- Almost Everything You Wanted to Know About Email Marketing - SilverPop, IBM Marketing Cloud
- Email Marketing - Entrepreneur.com
- The future of email marketing - EmailMonday
- Email Marketing - Business.com
- Email Marketing - Benchmarkemail.com
- Must read email marketing - Getvero.com
- Email Marketing - Hubspot

RELATED ARTICLE:
Email Marketing: A Powerful Sales Weapon is Right at Your Fingertips!
Looking to make the most of your marketing? Maybe you should look closer at your emails BikeRoar shows you the potential in your email marketing for... READ MORE
RELATED ARTICLE:
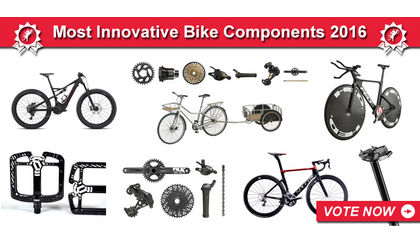
Most Innovative Bike Components of 2016
2016 was a good year for big breakthroughs in the bike industry BikeRoar selected the most innovative... READ MORE