With doping suspicions floating around in the cycling world, it's becoming increasingly harder to read an article and decide whether a pro cyclist is clean or not. Simply because a cyclist says "I'm clean, and have never tested positive" doesn't necessarily mean a thing anymore. Why? Because nearly every rider to ever say that has tested positive in retrospective testing, or personal admissions to guilt. Take Danilo DiLuca, who swore in front of school children and a priest, then tested positive! (Gives me shivers to think of the karma in that).
HEADS UP! We covered why riders might be admitting to doping in our previous article "Coping with Doping".
But never mind the readers of thousands of blogs worldwide - it's now a problem sports scientists are facing, and they're finding interesting ways of overcoming the age old lie of "I never doped".
HISTORIC CLIMB TIMES COMPARED
We'll start with a simple comparison of ride times on two of the most iconic climbs in the Tour de France. It is climbs such as these which are spoken of most regularly in discussions about doping.
Alpe d'Huez top 10 climb times
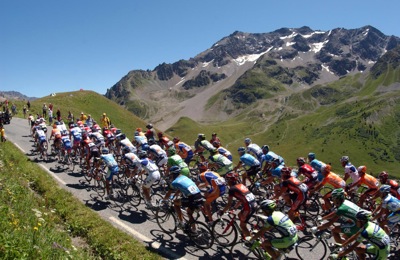
Photo: Taringa!
- 37:35 Marco Pantani 1997
- 37:36 Lance Armstrong 2004
- 38:00 Marco Pantani 1994
- 38:01 Lance Armstrong 2001
- 38:04 Marco Pantani 1995
- 38:23 Jan Ullrich 1997
- 38:34 Floyd Landis 2006
- 38:35 Andreas Klöden 2006
- 38:37 Jan Ullrich 2004
- 39:02 Richard Virenque 1997
- 39:31 Carlos Sastre 2008
- 41:21 Samuel Sánchez 2011
Mont Ventoux top 10 climb times
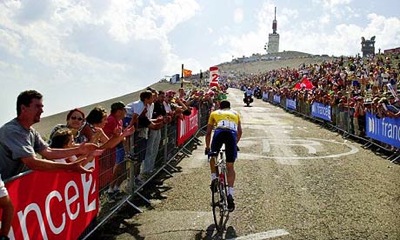
Photo: Peter Dejong/AP
- 55:51 Iban Mayo 2004
- 56:26 Tyler Hamilton 2004
- 56:50 Jonathan Vaughters 1999
- 56:54 Oscar Sevilla 2004
- 57:33 Alexander Vinokourov 1999
- 57:34 Marco Pantani 1994
- 57:34 Wladimir Belli 1999
- 57:39 Juan Miguel Mercado 2004
- 57:42 Joseba Beloki 1999
- 57:49 Lance Armstrong 2004
- 58:31 David Moncoutie 1999
- 59:00 Chris Froome 2013
As is clearly shown, the top ten climb times are all pre 2006 and generally pre 2004. After this EPO testing, in particular, got better and started catching users.
On Alpe d'Huez you need to go to the 17th fastest ascent before you reach someone who has never tested positive, been implicated or had suspicion surrounding results - in this case Carlos Sastre in 2008. Similarly for the Ventoux, David Moncoutie, recognised as a clean rider throughout his career, is 14th.
Note also the recent results: Sanchez on d'Huez in 2011 and Froome this year on Ventoux. Froome was by far the standout rider in this year's tour, smashing every other climber (apart from Quintana!), yet only managed the 23rd fastest time.
Pro cyclists in today's peloton are generally clean, or cleaner than in the past. This is due to some advances in drug testing protocols, as well as the requirements of team sponsors behind the major teams. But there is still speculation raised almost on a weekly basis relating to the performances of these top cyclists. Not because they aren't testing positive to Performance Enhancing Drugs (PED's) but because the mathematical calculations behind their performances just don't add up.
To put it simply, certain riders are achieving things that are physiologically impossible. Let's take a look at these 'measurements' used by sports scientists and critics, and see what they mean...
KEY PERFORMANCE INDICATORS
Power to weight ratio
Power to weight ratio is a very common measurement used in competitive sports, particularly cycling. It refers to the amount of power required to move a given weight. If you think about it this way, a larger weight requires more power to move forwards than what a smaller weight would need. Put a V8 engine into a Mini Cooper, and you'll get a phenomenal 'power to weight ratio'. This is why pro cyclists are so very weight conscious (aren't we all?).
Scientists are using rider weights, gradients and climbing times to determine a rider's Power to Weight ratio (P2WR), much in the same way that free websites do for you and us, such as Garmin Connect and Strava - whereby calculations are used to show your average power and P2WR. Most elite riders would be aiming to hit a certain 'Watts per Kilogram' (W/Kg) of body weight, around the 4 W/Kg mark, whereas a weekend rider would achieve around 2-3 W/Kg.
Scientists have agreed that achieving 5-6 W/Kg is achievable for a professional cyclist, and it seems believable, especially when these readings drop as riders reach the end of a long racing stage and are nearing exhaustion.
But the concern for critics lies in watching pro cyclists achieve 6.7 W/Kg after cycling a 170km Mountains Stage in Le Tour de France. This has been shown to be highly abnormal in what a human being can achieve, if only by a 'small' margin. Certain riders that have tested positive or admitted to doping have backed this fact up, by being the ones achieving such readings. The main concern now is watching today's clean riders occasionally achieve readings in the ballpark of being slightly suspicious.
But things are on the mend:
“What we are seeing now, is that the speed of the front guys is about 10% down on that (doping) generation of the past, and the power readings at the front is about 6W/kg again.”
- Dr Chris Tucker, University of Cape Town
So now when these abnormal readings occur, they are less severe and could indicate that only some riders are doping, and on a much lower scale.
Vertical altitude in meters (VAM)
VAM, Vertical Altitude in Meters, or Vertical Meters Climbed per Hour - it's all the same, and is an indication of how quickly a rider is going uphill. This measurement is a great training tool, but is slightly susceptible to errors due to a variety of parameters which could affect the final VAM reading. But critics still refer to it when trying to figure out if a rider is doping or not...
A recent example is in the 2013 Vuelta A Espana, where Chris Horner set a new VAM record on the famed Pena Cabarga climb, setting a time of 16m 44s and a VAM reading of around 1,972 meters. But it's not all clean cut when it comes to making accusations around a rider's VAM readings, as shown by Dave Brailsford, Team Principal of Sky Pro Cycling.
“...add temperature, wind, road conditions and aerodynamic drag of our riders, which we do know, and even with that it's hard. So when people start saying this and that, come on guys.... you'd know what you're doing is not scientific.”
- Dave Brailsford, Team Principal of Sky Pro Cycling
So when it comes down to the final word, it's close to impossible to truly find out if a rider is doping. But going by what the numbers show, the majority of riders are notably slower than in the past - during climbs, during time trials and during fast stages - the very same stages that were blitzed by riders of the past, most of whom doped to some extent.
So if we base the argument on the majority, it looks like things are moving in the right direction for the world of professional cycling. In this instance we do hope the majority rules and influences the few anomalies attracting criticism from the ever watchful eye of public opinion.
There will always be the odd few who go against the rules, but these very few are being pressured to come clean by the same riders they compete alongside. Here's to a cleaner peloton, for the sake of the riders...